Project
Sudden rainfall
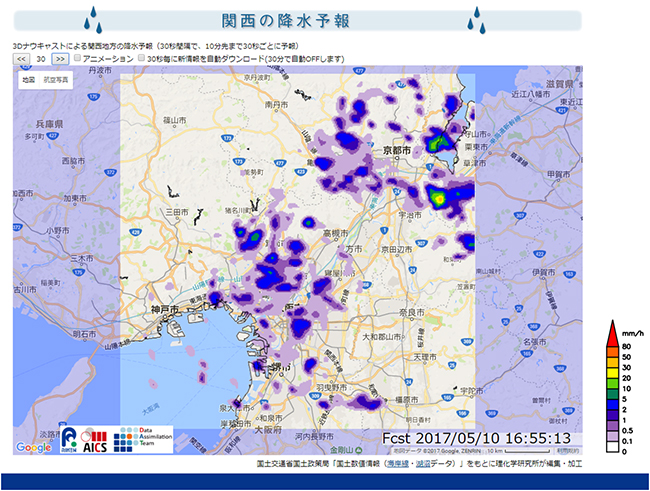
Using a powerful technique known as “3D nowcasting,” we have begun to provide, on an experimental basis, forecasts that predict the likelihood of precipitation in a given location ten minutes in advance. We will use the system to determine if the experimental forecasts, based on data that is updated every 30 seconds, could be used to prevent damage from torrential rains. The work uses a combination of phased-array radar and computer algorithms that make predictions based on data from the radars.
Disease progressions for clinical data
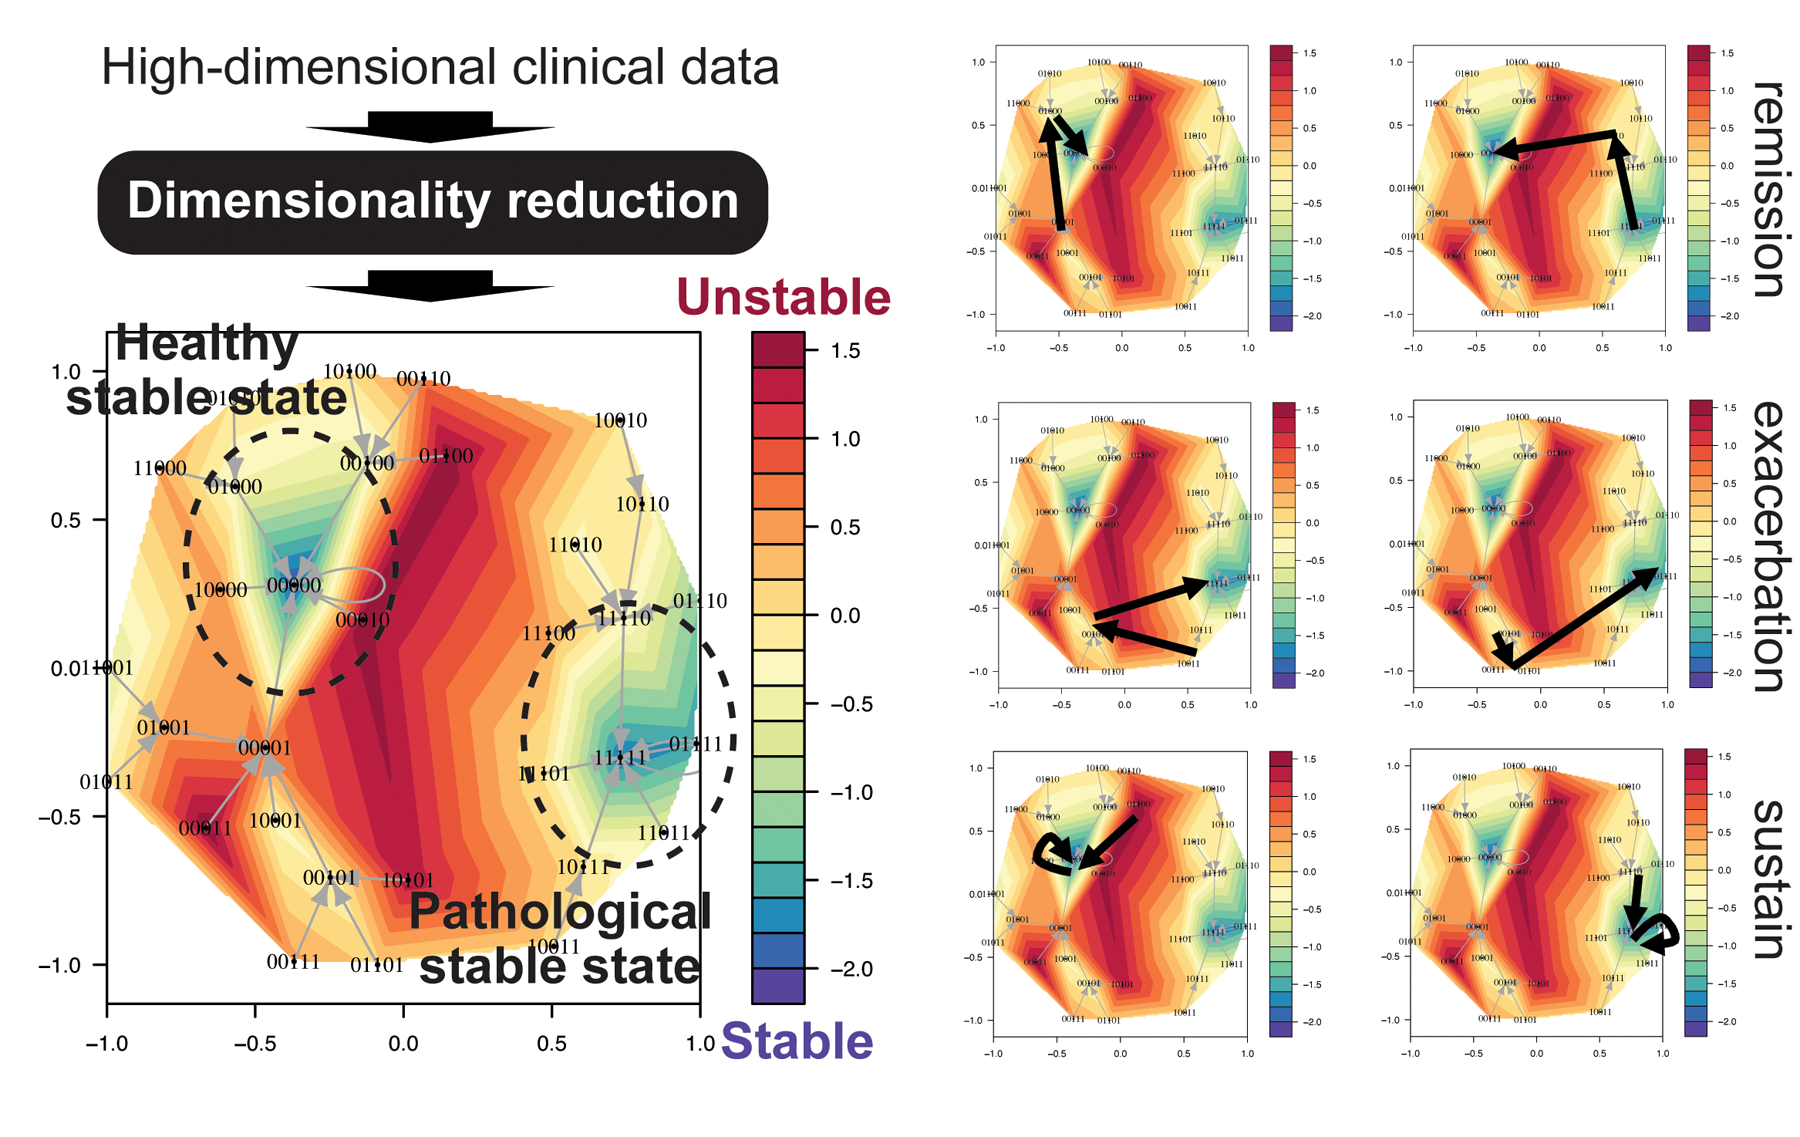
Figure is Energy Landscape Model of menopausal disorders. Valleys with blue to green have low energy, corresponding to stable states with high frequency of appearance, and mountains with yellow to red have high energy, corresponding unstable states with low frequency of appearance. The terrain is divided into two areas surrounding stable energy local minimum. By drawing the trajectories on this landscape, we can classify the state transition patterns of the menopausal symptoms for 4 months after the first hospital visit.
Landscape visualization helps us to understand the diversity and individuality of health/diseases, possibly leading to the discovery of new disease subtypes and presymptomatic conditions. Further, we may gain new insights into appropriate intervention timing, individual variation of drug efficacy, and ultimately how to implement precision medicine.
COVID-19
The ongoing pandemic COVID-19 has substantially changed people’s daily life and has also forced the researchers from different areas to use their knowledge for understanding and fighting this new coronavirus and its effects.
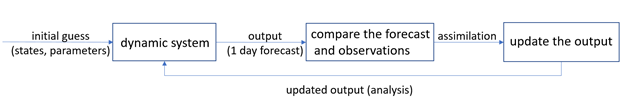
For deterministic infectious disease modelling, a basic model is the Susceptible-Infectious-Recovered (SIR) model. To represent the special structure of the spread of COVID-19, we have elaborated a special disease spread routine involving asymptomatic cases. However, detecting the asymptomatic individuals in a population is not easy. To deal with M incomplete or partially inaccurate observations, we combine ideas from machine learning with data assimilation. Since the machine learning methods also apply in predictions and simulations, we aim to apply these techniques on historical information to generate more reliable predictions.
Ocean Ecosystem
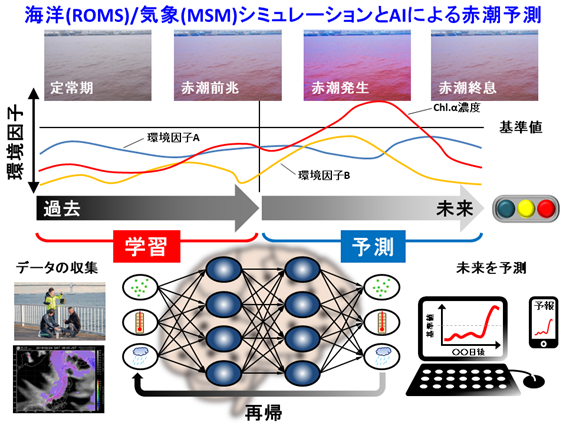
Harmful algal blooms (HABs) are an increasing problem in coastal waters. This phenomenon represents a threat to the environment, the economy and therefore to the society. We would like to find a wide, easy, accurate and detailed technique for predicting algal blooms. Elucidating the ecological state needed by the different algae to bloom could help to find a way to predict, manage and mitigate the HABs and their commonly detrimental impacts on the coastal environments.
Sampling the marine environment is difficult due to large spatial and temporal variations in chemistry, biology, and physics. Simulation can partially relive this spatio-temporal problem. The regional atmosphere/ocean model with land/ hydrological model can be utilized for this purpose. Both experimentally observed and simulated environmental factors can be machine-learned, then prediction modeling has been established for the future possibility of red-tide and its closure timing.
Biomedical sciences
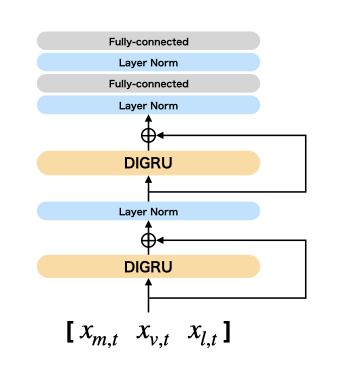
Figure shows a diagram of recurrent neural networks (RNNs) we used for early prediction of sepsis from real ICU data. The prediction model is able to make quite precise prediction by consensus of 6 RNN units. However, while using deep learning, how the model made such a decision is hard to understand by human being. By introducing mathematical approaches and data assimilation methodologies, we explore how to evolve this inexplicable prediction system explainable.
Typhoon
Weather prediction models attempt to predict future weather by running simulations based on current conditions taken from various sources of data. As a means to improve models, scientists are using powerful supercomputers to run simulations based on more frequently updated and accurate data.
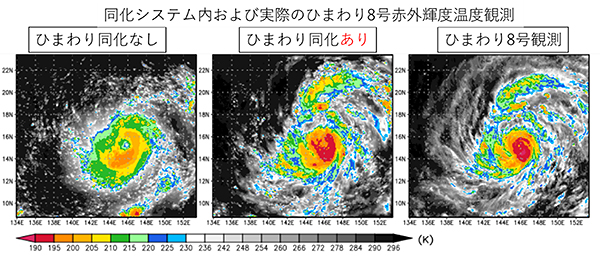
For the study on Typhoon Soudelor (2015), we adopted a recently developed weather model called SCALE-LETKF—running an ensemble of 50 simulations—and incorporated infrared measurements from Himawari-8 every ten minutes. We found that compared to models not using the assimilated data, the new simulation more accurately forecast the rapid development of the storm. We also tried assimilating data at a slower speed, updating the model every 30 minutes rather than ten minutes, and the model did not perform as well, indicating that the frequency of the assimilation is an important element of the improvement.
Cellular signaling pathway
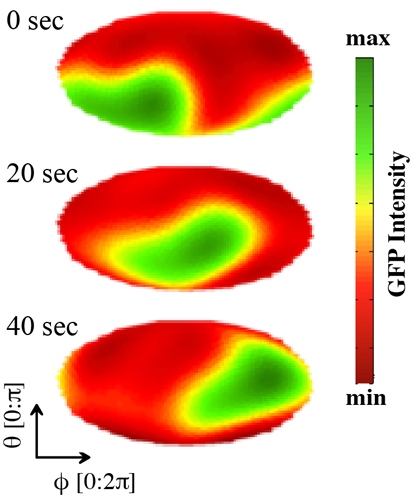
A challenge is to apply data assimilation to the data where only a few components can be observed. A key regulatory molecule in signal transduction system for eukaryotic chemotaxis is phosphatidylinositol 3,4,5-trisphosphate (PIP3). Under a chemoattractant gradient, PIP3 exhibits a localized accumulation along the gradient. However, even without chemoattractant stimulation, PIP3 is distributed non uniformly in a random direction with a spatiotemporal dynamics such as traveling wave. By combining a mathematical model of this signal transduction system with data assimilation method, we will develop a method to infer cellular states.